RSS feed for this section

Archive | Economic

Chart of the Week

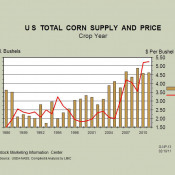
2011 02 15 G-NP-Annual_000

Dr. Curt Lacy (UGA) 500 pounds calves sell for $125/cwt. plus! Slaughter cattle selling for $105+, what could possibly go wrong? Plenty. The chart below shows the very strong relationship between corn supplies and prices. Given what we know about the tight global grain supplies, producers are strongly encouraged to keep a close eye on […]

Chart of the Week
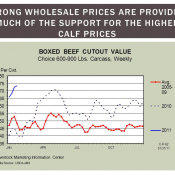
2011 02 04 boxedbeeffeb2011

Dr. Curt Lacy (UGA) Recently calf prices have been the highest in several years. The primary driver behind the higher calf (and slaughter cattle) prices has been the very strong wholesale price of beef. The boxed beef cutout value is the industry term for the weighted-average wholesale price of beef. In other words, the different […]

Chart of the Week

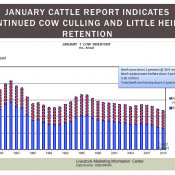
2011 01 28 jancattlenumbers-jan282011

Dr. Curt Lacy (UGA) On Friday, January 28, USDA released the annual Cattle report. This year’s report had several interesting findings. Total beef cows that had calved were reported to be 30.86 million head, down 2 percent from last year. Heifers held as beef replacements totaled 5.16 million down 5 percent from 2010. Overall, the […]

Chart of the Week

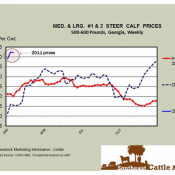
2011 01 21 Slide1_000

Dr. Curt Lacy (UGA) The chart below demonstrates the amazing run we have experienced in the cattle market in recent weeks. For the week ending January 21, 2011, prices for 500-600 steers and bulls grades 1-2 averaged 122.23, 22 percent higher than the five-year average and 28 percent above the same week last year. Many […]

Social Media Auto Publish Powered By : XYZScripts.com